Why Your COA Doesn’t Match Exactly (Purity, Assay, and Normal Variation)
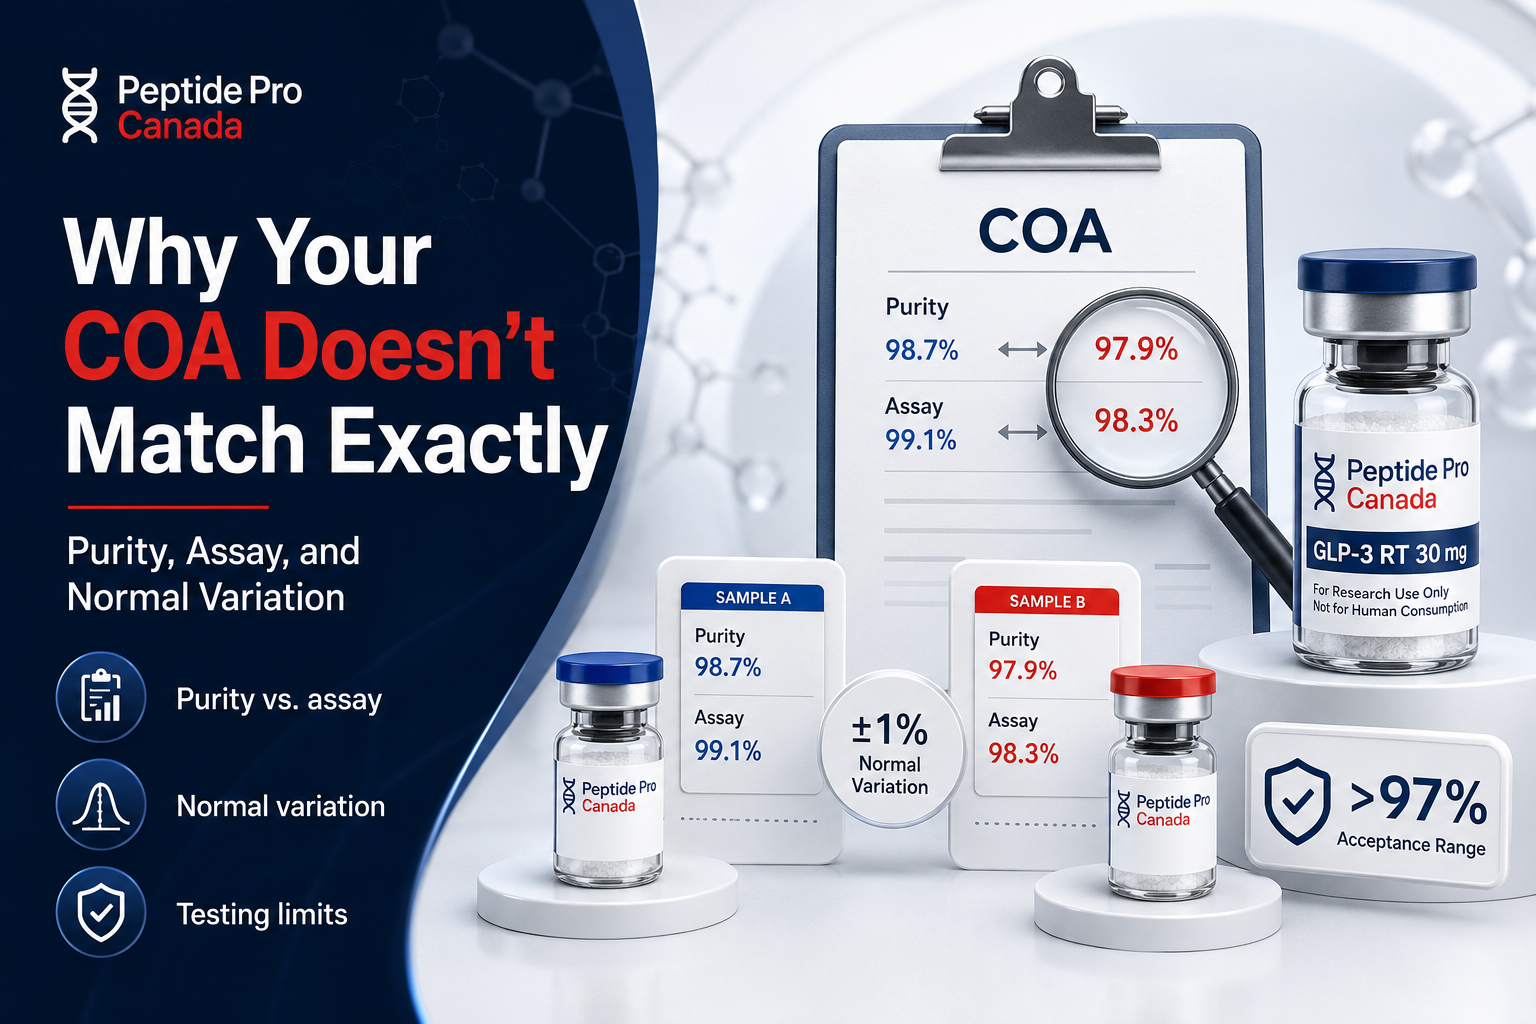
COA results vary because laboratories may test different samples, measure different characteristics, use different methods, or report results using different calculations and units. A difference does not automatically prove that either report is wrong—but it should be understood rather than dismissed.
Before comparing two Certificates of Analysis, confirm that they describe the same batch, sample type, analytical measurement, method, and units.
This article provides general laboratory information only. It does not provide medical, clinical, or personal-use guidance.
Why COA Results Vary Between Reports
Analytical results are measurements rather than perfect or absolute descriptions of an entire batch. Results can be influenced by:
- The vial or sample selected
- Variation within the batch
- Sample preparation
- Analytical method
- Instrument calibration
- Reference standards
- Chromatographic conditions
- Peak-integration settings
- Calculation and reporting conventions
- Measurement uncertainty
Some differences are reasonably explained by the method and uncertainty. Others may justify a repeat test, additional sampling, raw-data review, or investigation.
Purity, Assay and Quantity Are Different Measurements
The most common mistake is comparing different analytical measurements as though they answer the same question.
Chromatographic Purity
Peptide purity is commonly reported as a relative chromatographic percentage using high-performance liquid chromatography, or HPLC.
The laboratory may calculate the target peak’s area relative to other integrated peaks detected under the method. This can provide useful information about the chromatographic profile, but it does not automatically state how many milligrams of peptide are present in the vial.
A result such as 99% chromatographic purity does not necessarily mean that 99% of the vial’s total physical contents consists of peptide.
Assay or Content
An assay is a quantitative measurement of the target compound using a defined method, standard, and calculation. Depending on the method, assay or content may account for factors not represented by relative chromatographic purity.
Laboratories may use terms such as:
- Assay
- Peptide content
- Net peptide content
- Active content
- Content by weight
These terms should be interpreted according to the laboratory’s stated definition and method. Do not assume that every laboratory calculates them identically.
Peptide Quantity or Mass
Quantity testing estimates how much peptide is present in the tested vial or sample, often reported in milligrams.
A vial can have high chromatographic purity while containing more or less peptide than the labelled quantity. Conversely, a vial may contain the expected total amount while showing a lower chromatographic purity result.
Identity
Identity testing evaluates whether the tested material is consistent with the expected compound. Mass spectrometry or LC-MS may provide molecular-mass evidence supporting identity.
Identity, purity, assay, and quantity are separate characteristics. One result should not be substituted for the others.
Sample Selection Can Change the Result
A laboratory report directly describes the tested sample. If two laboratories receive different vials, they are not performing duplicate measurements on the exact same physical material.
Differences may reflect:
- Variation between vials
- Differences in fill quantity
- Non-uniform distribution of material
- Packaging or storage differences
- Different sample-selection procedures
- Damage or degradation affecting one sample
Testing multiple vials can provide more information about within-batch variation than testing one vial. However, even multiple samples cannot establish that every vial in the batch is identical.
Sample Preparation Can Affect Results
Before analysis, a laboratory may need to prepare the sample according to its method. Preparation may involve weighing, dissolution, dilution, extraction, transfer, filtration, or other steps.
Differences can arise from:
- Weighing uncertainty
- Volumetric measurement
- Incomplete transfer
- Incomplete dissolution
- Material remaining on the container
- Different solvents or preparation conditions
- Sample stability during preparation
Preparation differences are especially important when the final result depends on a calculated quantity rather than only a relative chromatographic profile.
HPLC Methods Are Not Necessarily Identical
Two laboratories may both report “HPLC purity” while using different:
- Columns
- Mobile phases
- Gradients
- Flow rates
- Temperatures
- Detection wavelengths
- Injection volumes
- Run times
- Data-processing rules
These differences can change how components separate and which peaks are detected or integrated.
An impurity resolved by one method may overlap another peak under a different method. A longer or more selective method may also reveal components that a shorter method does not separate clearly.
Peak Integration Can Affect Purity
Chromatographic software applies integration rules to determine where a peak begins and ends and how its area is calculated.
Results may change when:
- A small peak falls above or below an integration threshold
- Two nearby peaks are separated differently
- Baseline settings differ
- Noise is treated differently
- Manual integration is used
- The laboratory changes processing parameters
Raw chromatograms and integration details can be useful when an unexpected purity difference requires investigation.
Reference Standards and Calibration Matter
Quantitative results may depend on reference standards, calibration models, and instrument performance.
Potential sources of variation include:
- Different reference materials
- Reference-standard purity assignments
- Calibration range
- Calibration-model selection
- Instrument response
- Balance and volumetric calibration
- Quality-control acceptance criteria
A result should be interpreted in the context of the laboratory’s validated or verified method and quality controls.
Measurement Uncertainty
Every measurement has uncertainty. This does not mean the result is unreliable; it means the measured value is not known with unlimited precision.
The National Institute of Standards and Technology explains that measured quantities are never known with absolute certainty and that uncertainty is important for communicating confidence in chemical measurements. Read NIST’s overview of chemical metrology and measurement uncertainty.
Two results can differ numerically while still being reasonably consistent once their methods and uncertainties are considered.
Rounding and Reporting Format
Reports may display different numbers of decimal places or use formats such as:
- 99%
- 99.1%
- 99.12%
- Greater than 99%
- Pass
Displayed precision does not necessarily equal measurement accuracy. A report showing more decimal places is not automatically more reliable.
“Pass” is most useful when the report also provides the specification, measured result, method, and units.
Water, Salts and Counterions
A peptide-containing material may also include water, counterions, residual salts, or other non-peptide components. Whether and how these are considered depends on the measurement and reporting convention.
This helps explain why:
- Chromatographic purity may be high
- Assay or net peptide content may be lower
- Total vial mass may differ from peptide mass
Researchers should review exactly what the laboratory’s reported value includes and excludes.
Batch Variation Versus Measurement Variation
Differences between reports may come from the material, the measurement process, or both.
Batch or Vial Variation
This is actual variation among manufactured or filled units. Multiple-vial sampling may help evaluate it.
Measurement Variation
This arises when the same or similar material produces somewhat different results because of sampling, preparation, instruments, methods, calibration, or uncertainty.
Repeat analysis of a retained sample can help distinguish some measurement effects from vial-to-vial differences.
When a Difference May Be Reasonably Explained
A difference may be reasonably explainable when:
- The reports measure different characteristics.
- The methods or units differ.
- The samples came from different vials.
- The values are close relative to the methods’ uncertainty.
- Rounding accounts for the displayed difference.
- Both results remain within appropriate specifications.
This does not mean the difference should be ignored. The explanation should be documented and supported by the available evidence.
When Different Results Deserve Investigation
Further review may be appropriate when:
- Identity results conflict.
- The difference is large or unexplained.
- One result falls outside the applicable specification.
- Multiple vials show substantial variation.
- The batch number or sample identity does not match.
- The laboratory cannot verify the report.
- The methods are not disclosed.
- Raw data do not support the reported result.
- A repeat test does not reproduce the original finding.
- The result could materially affect the planned research.
Useful Investigation Steps
Depending on the issue, researchers may consider:
- Confirming that product, batch, sample, and report numbers match
- Determining whether the same characteristic was measured
- Comparing methods, units, and specifications
- Requesting raw chromatograms or supporting data
- Reviewing integration and calculation methods
- Confirming laboratory calibration and quality controls
- Repeating analysis on the retained sample
- Testing an additional independently selected vial
- Using an appropriate independent or orthogonal method
- Documenting the conclusion and corrective action
What to Compare on Two COAs
Before deciding that two reports conflict, compare:
- Product and peptide name
- Lot or batch number
- Sample identifier
- Testing laboratory
- Analytical characteristic measured
- Method and instrument
- Units
- Specifications
- Reported uncertainty, if available
- Testing and report dates
Use our research peptides glossary when reviewing unfamiliar analytical terms.
Frequently Asked Questions
Should every laboratory report exactly the same result?
No. Exact numerical agreement is not generally expected across different samples, preparations, instruments, methods, and laboratories. The size and significance of a difference must be evaluated in context.
Is purity the same as assay?
No. Relative chromatographic purity and quantitative assay or content are different measurements.
Can a high-purity vial contain the wrong quantity?
Yes. Purity and peptide quantity are separate characteristics.
Is a lower result automatically wrong?
No. First confirm what was measured, how it was measured, and whether the reports are directly comparable. A lower result may still require investigation if it is outside specification or materially different.
Does an unexplained difference mean the product is defective?
Not automatically. It means more information may be needed. Sample selection, methods, measurement uncertainty, and actual batch variation should all be considered.
Where can I learn to interpret a complete COA?
Read our guide on how to read a peptide Certificate of Analysis and review available reports through our COA page.
Final Comparison Checklist
When COA results vary, confirm:
- The reports describe the same product and batch.
- The same analytical characteristic was measured.
- The samples and sample-selection methods are understood.
- The analytical methods and units are comparable.
- Specifications and uncertainty are considered.
- Raw data are reviewed when necessary.
- Significant or unexplained differences are investigated.
Differences between COAs should neither be automatically dismissed nor automatically treated as proof of failure. Careful comparison of the samples, methods, measurements, and supporting data provides the strongest basis for interpretation.